I'm Edil Baiyzbekov
An award-winning data visualization developer, software engineer and artist👨🏽‍💻

I find new ways to tell, feel and experience stories with data.

baiyzbekov.edil@gmail.com
linkedin logo
github logo
telegram logo

Use arrow keys or tap below to navigate

My stack

Intro

I’m passionate about connecting cutting-edge technologies, art, climate action, and social responsibility to tell powerful data stories and create impactful projects. With a diverse background in creative tech, journalism, and NGOs, I bring a unique perspective and skill set to every project.
I worked as a Lead Data Visualization Engineer at Infogr8, Full-Stack developer at UNICEF Office of Innovation, and Data Journalist for Radio Free Europe/Radio Liberty, Texty.org.ua, and other NGOs. I also love to speak publicly, empowering communities to take action.
Tap right to see technologies I used in my projects👨🏽‍💻

Project 1 : Sound of War

Intro

Stack: TypeScript, D3, Svelte, SvelteKit, React, NextJS, ThreeJS, JavaScript, TailwindCss, Mapbox, Nodejs, WebGL, Threlte, Layercake.
Python, pandas, selenium, bs4, numpy, asyncio, keras, scikit-learn, SQL.
C#, Unity, DOTS, Tiny.
QGIS, Spark AR, Tableau, flourish, datawrapper, Ableton, spreadsheets, git, figma, adobe Illustrator, blender, adobe premiere.
Ok, enough talking, tap below to see my stack in action!🚀

Project 1

My Stack

Audiovisual data art project: How Russia shelled Ukraine

2023

👨🏽‍💻 TypeScript, Threejs, Threlte, Blender, Ableton

Project 2 : Unity simulation

My Stack

Data visualizations can tell powerful stories. But we can lose our emotional connection with people experiencing war in the sea of statistics and graphics. Over time it's getting harder to understand the scale of destructions Russia the terrorist state commits in Ukraine. I created this project to let you listen to the war data and explore it from a new perspective. I made an interactive 3D map with flowers representing different attacks. The most exciting part is a data generated music from news media about shellings in Ukraine. Take a look and experience the project!

Project 2

Project 1

Ukrainian COVID-19 victims on the streets of Kyiv.

2021

👨🏽‍💻 C#, Unity, WebGL, JS, Blender

Project 3 : odi D3

Project 1

The idea for this project came from a realization about how difficult it might be for a reader to process the number of deaths caused by COVID-19. Graphs and tables just can’t communicate the severity of the problem or approach it from a humane position. I made a WebGL 3D simulation of Kyiv’s city center with Unity Game Engine, C# and JS. You can change the number of people, walk among them and see the crowded streets from a bird’s-eye view.

Project 3

Project 2

How well is your country doing on policy for the secondary use of health data?

2022 preview of odi project

👨🏽‍💻 JavaScript, D3
🏅 DataComms Awards

Project 4 : DoD SvelteKit D3

Project 2

I’ve developed an interactive timeline app to track European Commission (EC) policy activity around the secondary use of health data and expanded the functionalities of the exploration data tool. The most exciting part of such apps is that custom D3 visualizations become part of the UI. Users can find more insights or call to action by interacting with graphics.

Project 4

Project 3

Custom interactive data portal about the US tech manufacturing workforce.

2022 preview of dod project

👨🏽‍💻 SvelteKit, TypeScript, TailwindCss, D3

Project 5 : Instastory

Project 3

I’ve developed an interactive data portal that increases knowledge around the US advanced tech manufacturing workforce. It’s a full-stack application made with modern state-of-the-art stack leveraging SvelteKit, TypeScript, Tailwindcss and Layercake framework to build Custom D3 charts in Svelte way.

Project 5

Project 4

How Kyrgyz parliament copy-pasted russian laws.

2020

👨🏽‍💻 Python, JS, html, flourish
🏅 Top-10 by GIJN

Project 6 : undefined

Project 4

I scraped and analyzed all bills of the 6th Kyrgyz parliament and found that about 40% of them have similarities with Russian bills. 17 bills were almost complete copies of Russian laws.
I designed this project in Instagram-story format using JS, html, css and flourish animated charts. It was also featured in a top-10 data stories rating by GIJN🎉.

Project 6

Project 5

Map visualization of digital public goods for Unicef Office of Innovations

2021

👨🏽‍💻 MapboxGL, React, scrollama

Project 7 : Scrolly D3js

Project 5

I created an interactive, easy-to-edit and rich dashboard that shows where open source tech solutions for good are deployed, developed, and which Sustainable Development Goals they achieve in each country. I built this project with NextJS, React, Mapbox GL and scrollama. Digital public goods are open source software, open data, AI, standards, and content that digitally harmless, and relevant to UN’s 2030 Sustainable Development Goals.

Project 7

Project 6

How Kyrgyz parliamentarians change their political parties.

2020
Click to see the project, eng

👨🏽‍💻 Python, JS, D3, scrollama
🏅 Top-10 by GIJN

Project 8 : femicide

Project 6

Members of Kyrgyzstan’s parliament often choose their political party by how well its agenda aligns with their personal goals rather than their political values. This results in representatives frequently moving to parties that better suit their private interests, even if their agenda is opposite to their previous union’s program. I analyzed the composition of the six Kyrgyz parliaments and visualized this process using D3 and scrollytelling. This project got in top-10 data stories rating by GIJN🎉

Project 8

Project 7

“I would have killed her anyway”. Investigation of femicide in Kyrgyzstan

2020 preview of the femicid project

👨🏽‍💻 Python, Selenium, asyncio
🏅 Winner of the Sigma Awards 2021

Project 9 : Ar project

Project 7

This project is a winner of the international data journalism competition The Sigma Awards 2021 🎉. There are no publicly available official statistics on women’s murders in Kyrgyzstan. So I scraped more than 54000 criminal news articles to understand the femicide patterns in Kyrgyzstan. We identified around 80 words and sentences in accordance with femicide criteria. Then I created a Python script that converts them into flexible regex patterns to fit the complex structures of the Russian language. It let me find more than 3000 news and press releases that covered the women’s murders.

Project 9

Project 8

AR-game quiz about covid myths

2020
Yeah, that's me!😜

👨🏽‍💻 Spark AR, Figma

Project 10 : Automation

Project 8

The first ever AR-mask in Instagram that tells a data story about gender inequality. It reached more than 650k views and 6200 shares.

2020 gif of my AR project

Project 10

Project 9

A telegram bot for victims of domestic violence to safely ask for help.

2020

👨🏽‍💻 Python, MongoDB, Heroku
🏅 Winner of the UN hackathon

Other projects :

Project 9

This telegram bot helps women to recognize signs of domestic violence, gives them information on how to protect themselves and connects them to the nearest crisis centers. My team developed bot at the UN hackathon. We have won the 🏅1st place in the competition.

Other projects

Project 10

Let’s collab!🚀

Tap right to see other projects

Why is it getting hotter in Bishkek - explained on heat maps.
I used raw satellite data in QGIS to calculate the surface temperature and the vegetation index.

2019 gif of my QGIS project

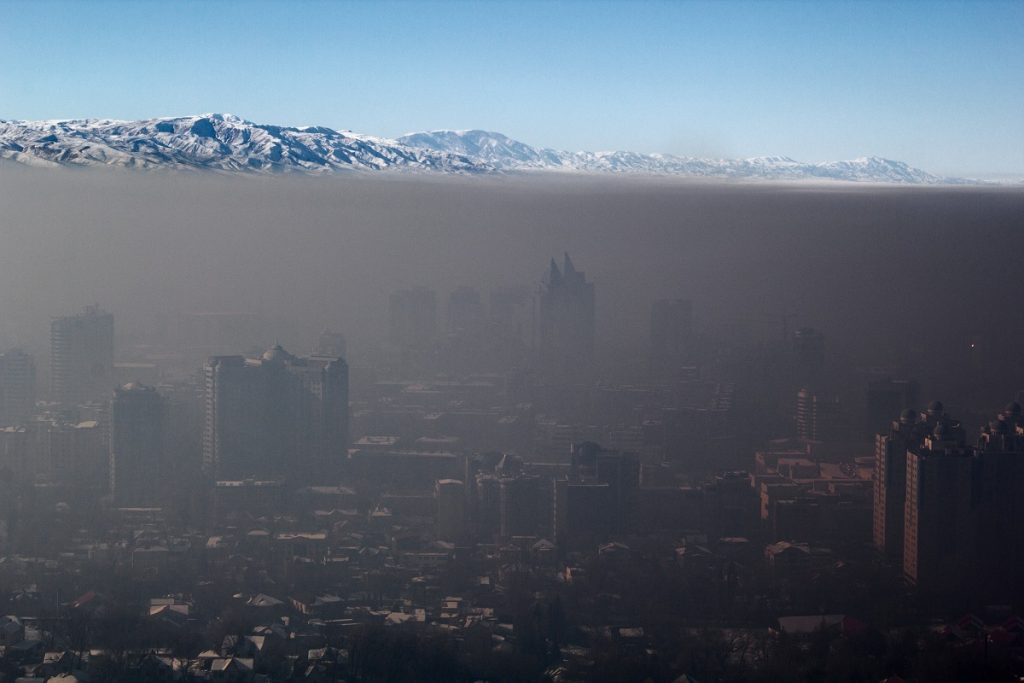
How polluted Central Asian air is.
The first media research about air pollution in Central Asia.

2020 preview of my air pollution project

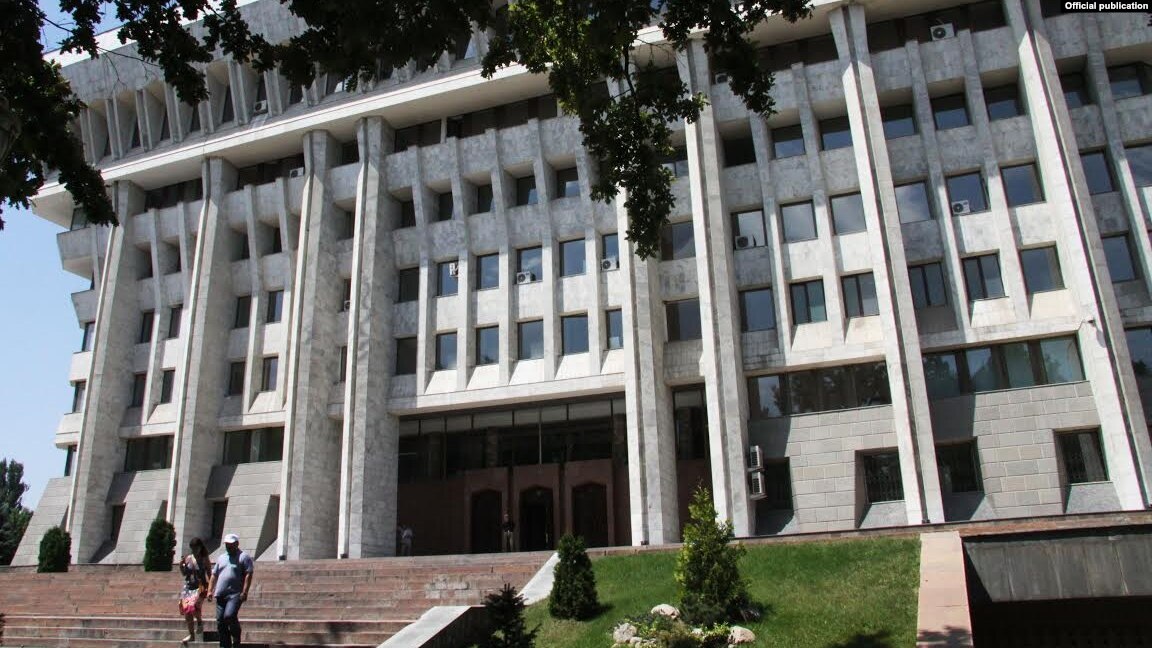
How Kyrgyz parliament members violate regulations and pass laws without a quorum.
I scraped, cleaned and analyzed protocols of meetings for this investigation.

2020 preview of currenttime project

Project 10

Oh, You’re really interested in my work!)
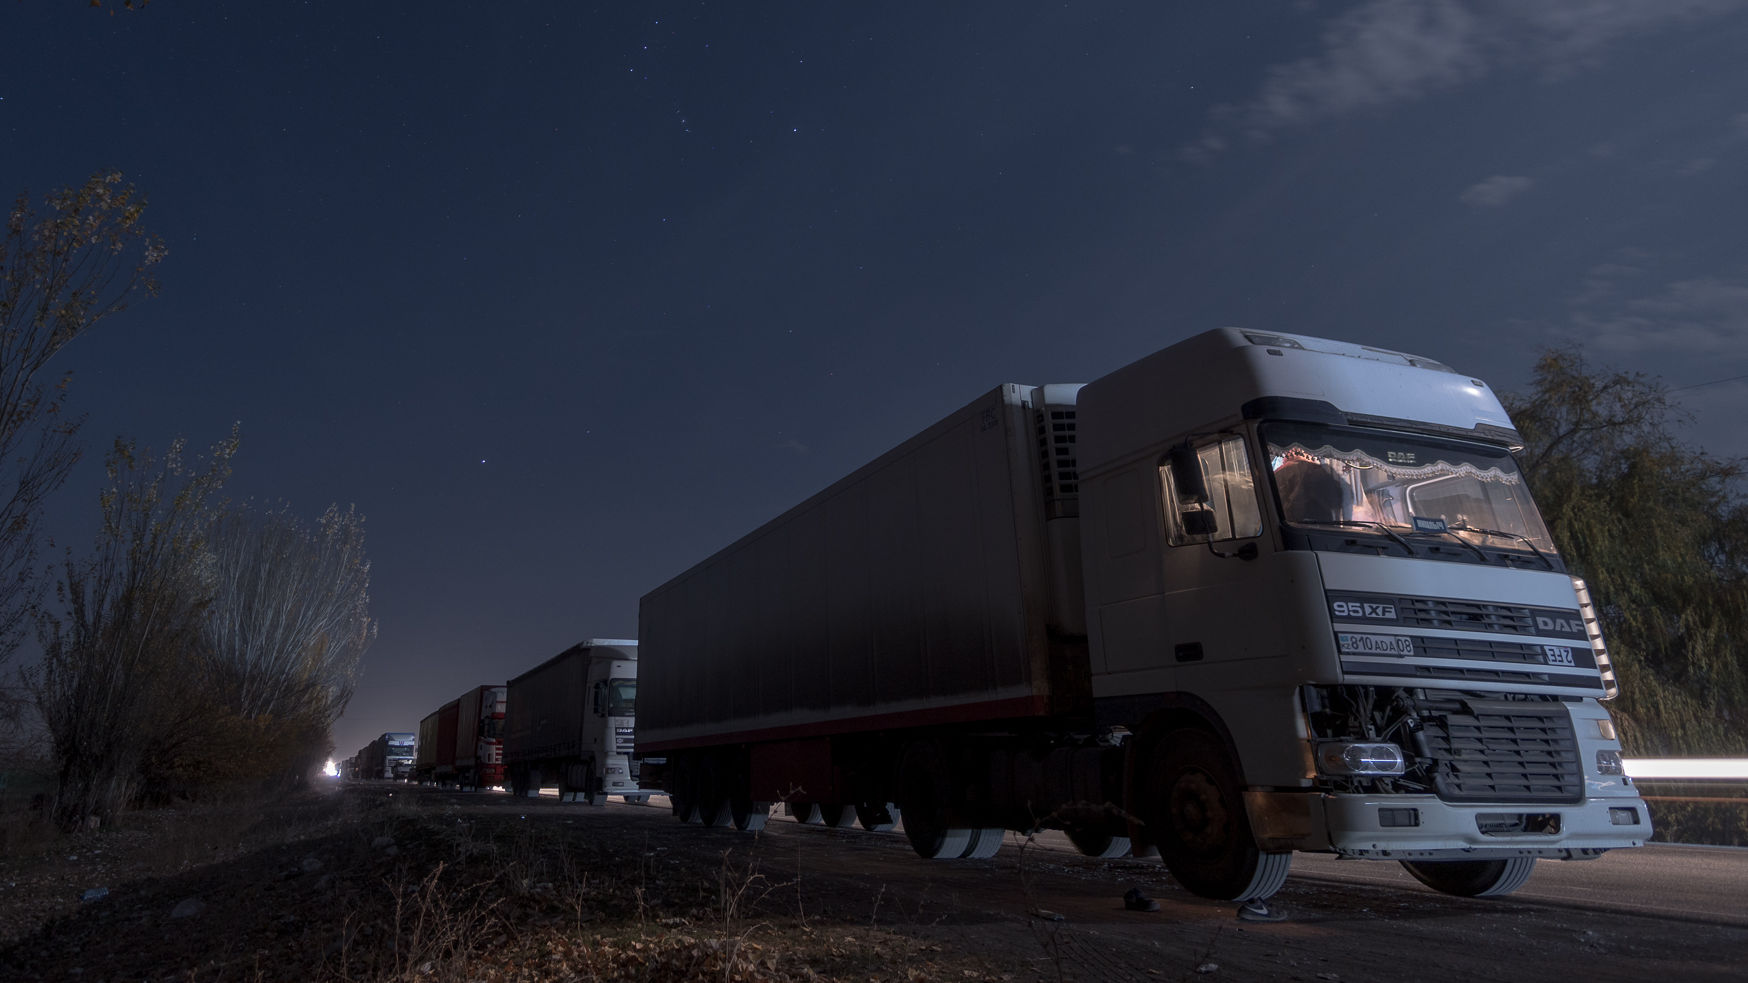
Watch "Pump the air, the movement is on." A short documentary about traffic jams at the border of Kyrgyzstan.
I created this film when I worked as a lead video producer in Kloop.

2017 preview of documentary film project
Only russian version